
Learn how to make the most of the Individual Positions pages and their features
Start exploring
Each positions table on our platform can take you to a page with more detailed information about that position in your portfolio. Depending on the position, you can see various aspects of its history and contribution to your portfolio.
Take advantage of our news and insights
Each position has tailored insights that can help you analyze their place in your portfolio and start thinking like a professional.
We also provide a news and events feed that gives you updated financial information related to the position you are looking at.
Start with the basics
The summary allows you to get an overview of your positions' performance by breaking down key metrics such as P&L.
In the table below you are able to see and sort by any other attributes and get multiple angles on the same position.
Look at your history
You are able to see the price history of your position and when you chose to buy and sell.
You can reevaluate your history and whether trades were beneficial in order to gain perspective and make better future decisions.
See the big picture
In this graph you're able to gauge your performance with cumulative P&L. This shows you the total your position has contributed up until a certain date.
Deep dive
The Transactions and Income table give you a more detailed overview of your history with this position.
You can sort both by column, and for transactions you can add extra fields for even more data.
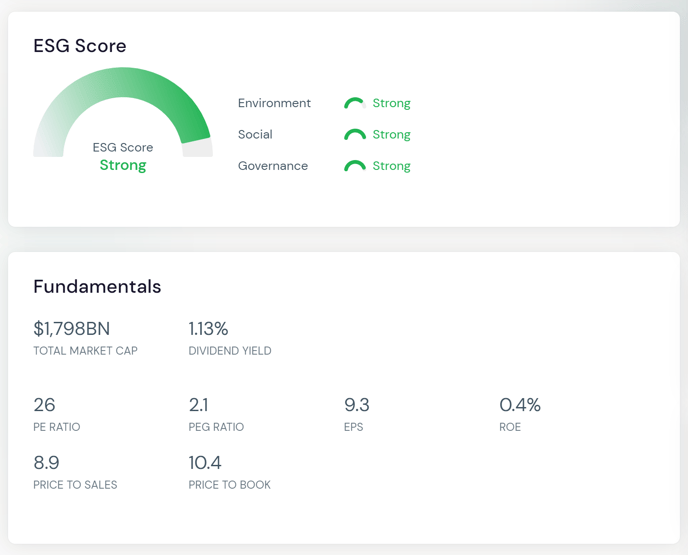
Key metrics
Finally, you are able to see the even more fundamental data that can give you an even greater understanding of the positions' performance and contribution to your portfolio.
If you’d like to learn more about how to make the most of each page, we have similar walkthroughs linked below.