This guide helps you understand why each insight is good to know and how it helps you analyze your portfolio
Your instrument’s comparative performance
This highlights whether this instrument has out or underperformed the benchmark.
Your instrument’s volatility impact
This highlights the instrument’s risk in comparison to the benchmark.
Your instrument’s overall exposure
This highlights how much of your portfolio’s exposure is allocated to one instrument.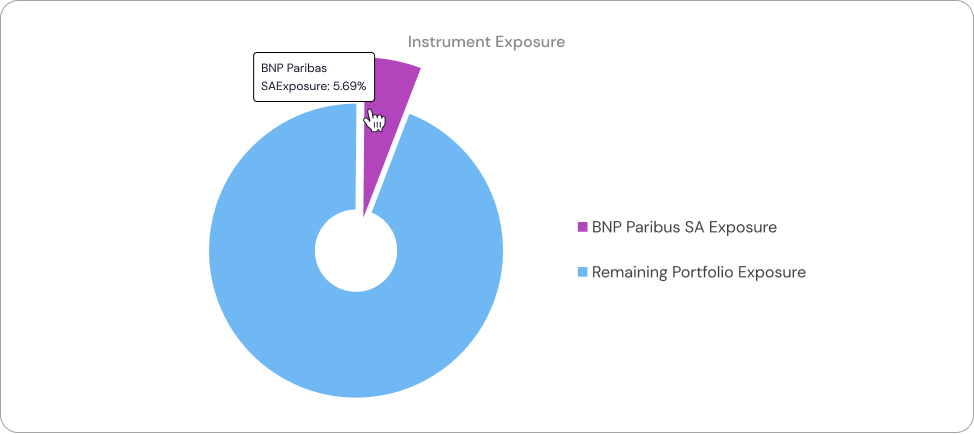
Your instrument’s largest single day gain and loss
When considering allocations or strategies, you should be mindful of these large single day swings.

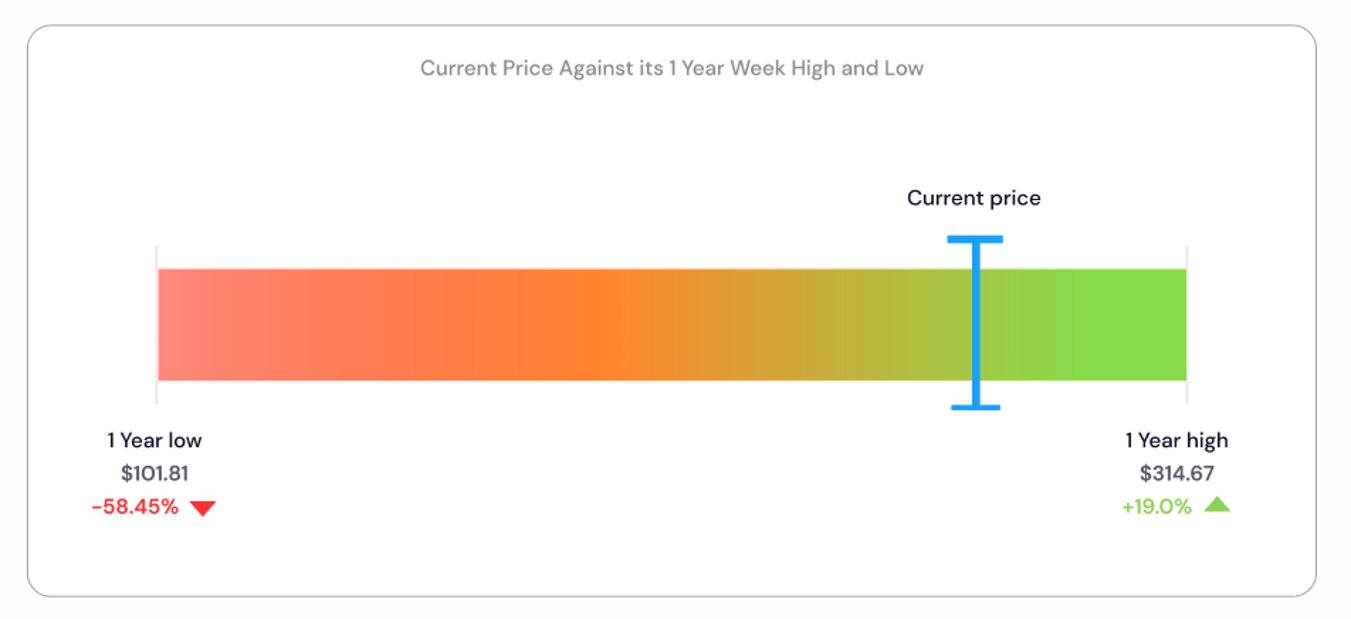
Your instrument’s price vs its 52 wk range
This gives you an overview of how investor sentiment is positioned and highlights if the instrument may soon exhibit new trading patterns. e.g., if price activity is near the top, prices could breakout higher or retreat and vice versa if price activity is near the bottom.